Wednesday, November 12, 2014

Simple Moving Average

In technical analysis the most commonly used type of moving average is the simple moving average (SMA), which is sometimes called an arithmetic moving average. It is referred to as ”simple”, because it uses a simple way of averaging. A SMA is usually constructed by adding a set of data and then dividing it by the number of observations during the period, which is being examined.
How to estimate the value of a simple moving average?

In order to estimate the value of a simple moving average, we need the following:

First, to define a number of trading sessions (periods), which will be used in the calculation. Let us use the 10 most recent trading days (sessions).

Second, to decide what type of prices we shall use. Most moving averages of prices are based on closing prices, but these averages could also be estimated with the use of highs, lows, daily means etc. Let us use the closing prices in our case.

Third, to calculate a simple average value of these prices.

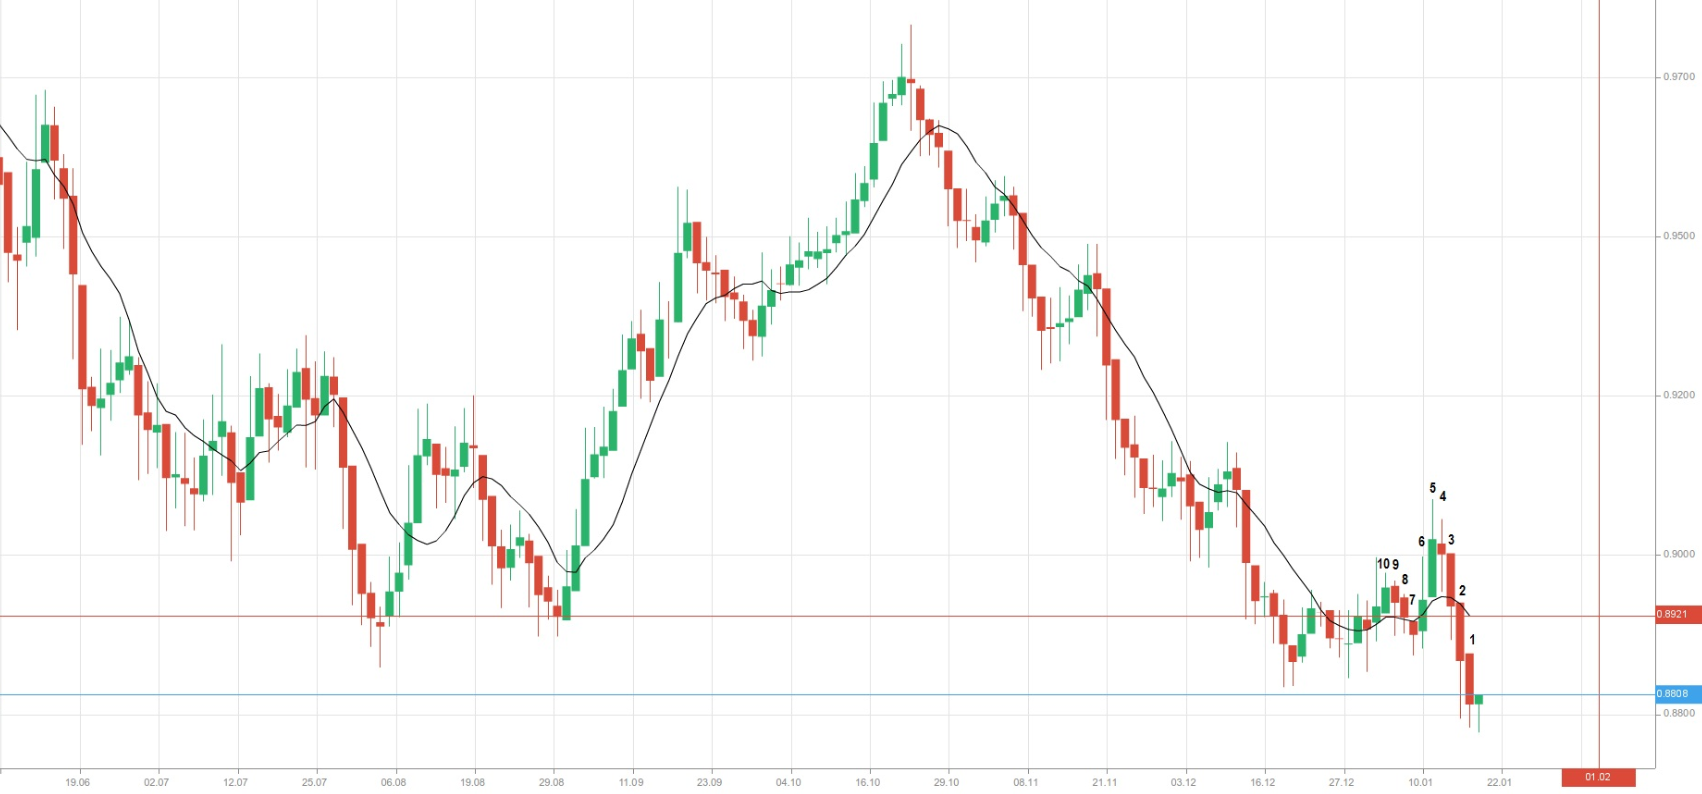
Let us look at the following graph (graph 1).
SMA graph 1
On the chart above we can see a 10-day simple moving average (the black line), with its value shown in the red rectangle (0.8921). The marked candles represent the periods (10 days, because we use a daily chart), which closing prices take part in the calculation of the SMA. We count the candles in the opposite direction, because moving averages take into account the most recent number of periods. The most recent green candle has no SMA, because the trading day is not over yet and, respectively, there is no closing price. Therefore, it cannot be used in our calculation. Tomorrow, in order to estimate the SMA value, candle 10 will be replaced with the current-day candle, which will already be closed. It is how the moving average indicator moves across the graph.

Now, let us present the close prices of the 10 marked candles. We have to sum all the close prices and divide the sum by the number of periods (days).

Trading DayClose Price
10.87777
20.88196
30.89143
40.89649
50.90522
60.89942
70.88975
80.88993
90.89257
100.89665
10-day SMA0.89212

So, the 10-day SMA has a value of 0.8921, exactly the same as shown in the rectangle above.
What do we mean when saying that the SMA is moving across price action?

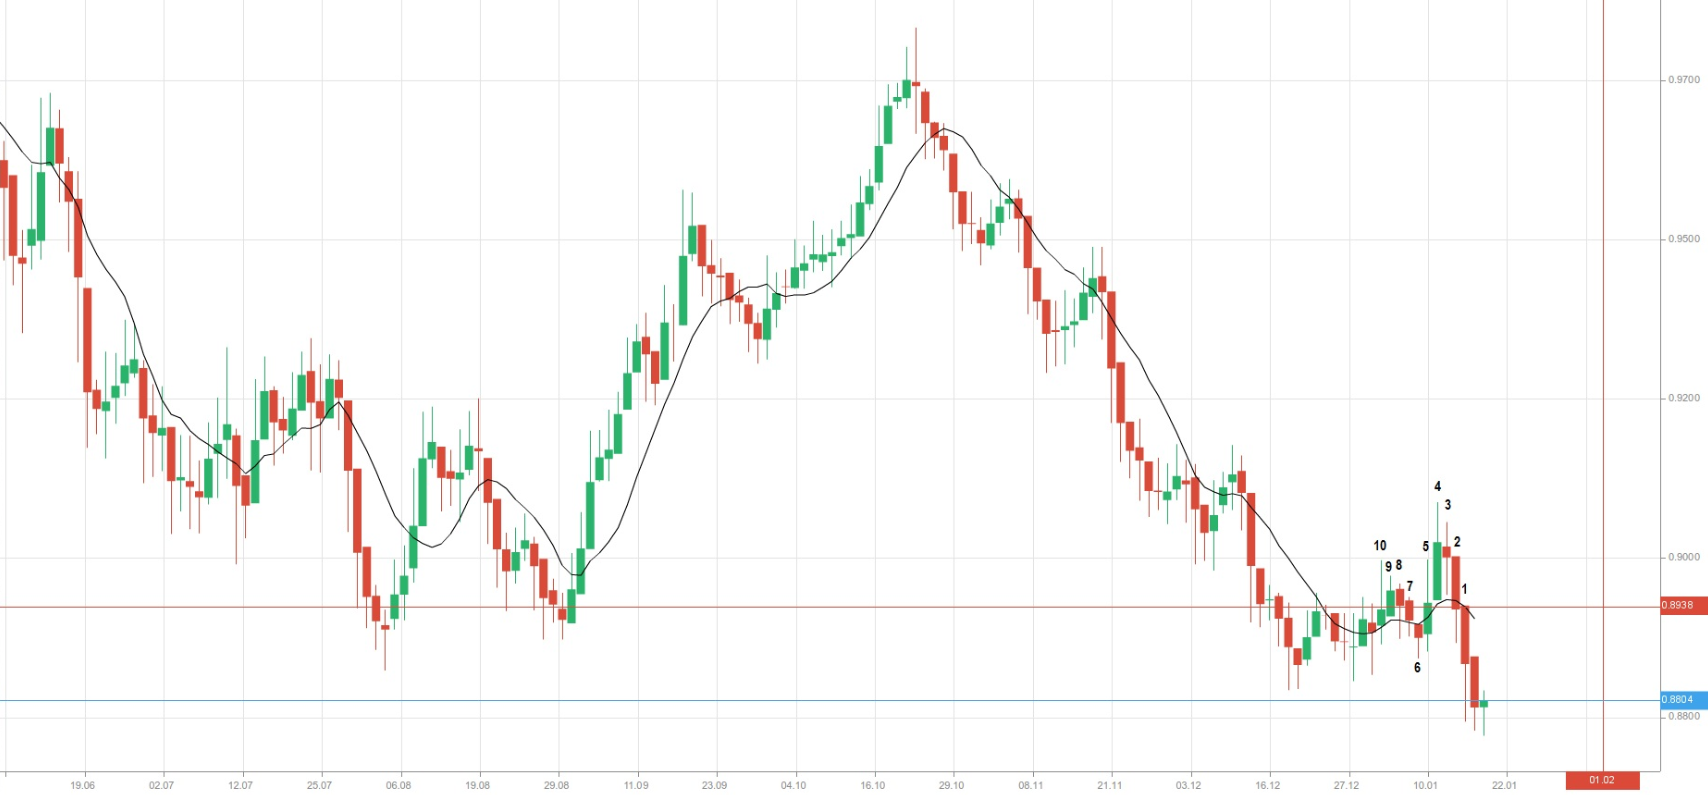
Let us move one day back and imagine the same situation as above. Now candle number 1 on graph 1 will not be taken into consideration when calculating the new SMA, as it has not yet closed. At the same time, we should take into account the candle, which stands before candle number 10 on graph 1.
SMA graph 2
Trading DayClose Price
10.88196
20.89143
30.89649
40.90522
50.89942
60.88975
70.88993
80.89257
90.89665
100.89450
10-day SMA0.89379

So, the new 10-day SMA has a value of 0.8938. What can we observe in the table above? It seems that all the close prices remain the same with the exception of just one – that of the 10th day. Tomorrow, when calculating the SMA, the trading platform will replace candle number 10 on graph 1 with the most recent candle, or the candle for the current day.

Beginner traders should note that simple moving averages can be calculated for different time frames. In case we use a 15-min chart, where each candle stands for a 15-minute period, the SMA indicator will show the average closing price for the past 10 periods, or 150 minutes. If we apply the SMA on a 1-hour chart, it will show the average closing price for the past 10 hours. This, of course, will be valid, if we keep the period number unchanged.
Simple moving averages may differ in length

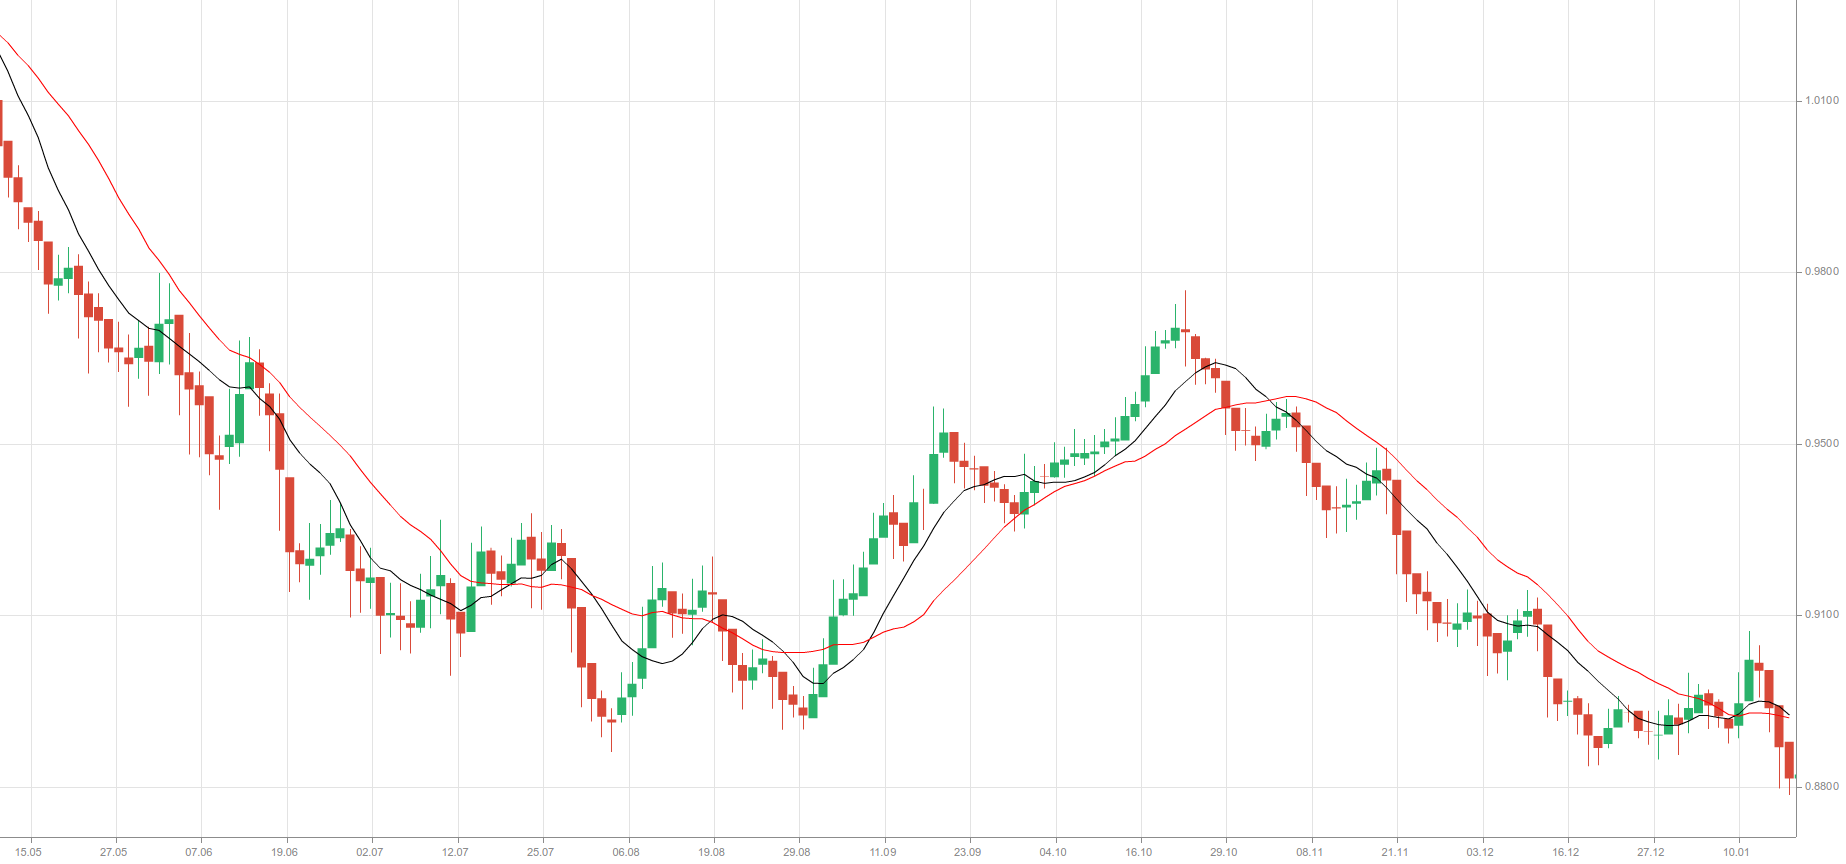
We can construct moving averages of different lengths. On the next graph we can see another moving average, a 20-day SMA (the red line). It is calculated by adding the 20 most recent closing prices and dividing the sum by 20.
SMA graph 3

Some of the most popular daily moving averages are for the periods of 200, 80, 50, 30, 20 and 10 days. These periods are considered as arbitrary and were chosen in the days before the invention of computers, when calculations had to be done by hand.

The 10-day, 20-day and 80-day moving averages represent approximately two weeks, one month and four months of trading data respectively.

Longer moving averages usually pick up changes in a trend more slowly, but yet, it is less likely that they will give a false signal for a trend change, because they represent a greater number of data observations, or more information. The more data we include in the calculation of the SMA, the less important each day’s data becomes in this calculation. A large change in the value of data during one day would not cause a large impact upon the longer-term moving average.

If we look again at the graph above, we can notice that the 10-day SMA demonstrates more variability than the longer, 20-day SMA. The latter is said to be the slower, the lazier moving average. It provides more smoothing, but it is also slower at indicating trend reversals.
SMA and the trend

Moving averages are valuable, as they smooth daily fluctuations, allowing the technical analyst to see the underlying trend without being distracted by the small (daily) movements. A rising moving average usually signals an uptrend, while a falling moving average indicates a downtrend. Some analysts have adopted the following approach, when it comes to relating the SMA with a particular trend: If the close price of a tradable instrument is above some simple moving average, then the trend must be bullish. If the close price is below some simple moving average, then the trend must be bearish. However, choosing a period for trend estimation is a matter of personal preferences. The period of the SMA will depend on one’s trading style and time frame for trading. Thus, choosing the appropriate period comes with experimentation and, of course, experience.

Despite that simple moving averages provide help when identifying a trend, they do so after the trend has begun. Therefore, moving averages are lagging indicators, as they are based on past prices.

Monday, June 30, 2014

Stock Trading Binary Options

The popularity of Stock Trading is growing higher and higher within the traditional market and binary options market. More and more binary options traders depend on stocks, because it’s easier than you think to determine their own short-term movements. Needless to say, this doesn’t mean easy money; because you can risk and you will be prepared to lose some profit in case this trade doesn’t close as part of your favor.


One of the simplest strategies of which binary options traders use is finding a stock which has gained some momentum and betting that it will reach a certain price before this expiry. Of course, this sounds way too simple, but it is the most fundamental strategy to win money by trading stock in binary options platform.

Global Stocks Trading
Trading stocks might sound like the simplest way to invest your money in the binary options market, but there are some things you should know before taking this step. First of all, stocks are different from nearly all assets that is usually traded on the binary options market. You should understand that some foreign stocks and shares, for example U.S. stocks, are only available for investing during specific hours. This means that you won’t be able to trade 24/7 and your trading activities will likely be limited to a specific time window.
Another significant fact is that brokers have taken some measures to make sure that trading stock binary options isn’t simple. As we stated earlier, trading stock binary options is available at certain times. However, many brokers won’t enable their clients create a trade at least half an hour before the market opens – in this way the traders are not able to trade stocks during the time in which they may be the most volatile.

Trading Stock Binary Options
Trading stock binary options can be a powerful way to gain your profits, especially if your trading portfolio has room for brand new assets. Of course, you must approach these options very cautiously, because it is essential that you select the right stocks and create a fool-proof-trading plan that you’ll follow closely. There are four principal factors, which have a great impact on the value of the major stocks:

Market Sentiment – if the markets are miserable and the global economic climate is humble, investors won’t spend their money on stocks and therefore their value will fall.

Earning Reports – Good or bad earning reports often cause a rapid movement of the value of certain stocks

Mergers & Acquisitions – These events typically lead to positive results, so you should always expect a stock’s price to increase when one of these two events happens.

Government Policies – Some stocks may be influenced by different government policies.

How you can Trade Stock Binary Options
The 1st step is to identify with what direction the stock will head after a news release affecting the share price on the company in question. Via there, the trader is free to choose any binary options trade type to install his trade profile. As an example, an earnings report can result in a sustained response that lasts for a lot of days. In such a scenario, the trader can decide to trade the Touch/No Touch option, using a correct price barrier while having into cognizance any latest supports or resistance levels. If there is a very strong news release that will cause the share price of any company to spike in different direction, the trader can decide to trade any of the high-yield option varieties. For example, the sudden announcement by the CEO of JP Morgan around the trading losses recently sustained on its positions is the kind of news release that can result in a move so hard which it could breach the price barriers on the high-yield option types. It is ultimately nearly the trader to determine what type of trade will suit this news release he wants to trade.

Final Word of Stock Trading
Trading stock article takes some understanding of how stocks behave in order to profit from it. Stocks constitute one of the asset derivatives that can be traded on the binary options market. Usually, a trader will have access to trade hundreds of stocks, as brokers will list several stocks from the different stock exchanges across the world.
A good spread will include stocks from the three American Exchanges, the London Stock Exchange, and the Stock Exchanges from Germany, Spain, Switzerland, the Eurostoxx Exchange (which contains stocks of companies in the Netherlands, Belgium, and other central European nations) as well as stocks from some selected Middle East exchanges. This gives traders and unbelievable spectrum of stocks to change.

Friday, June 20, 2014

Support and Resistance Strategy for Binary Trading

In which the breakout strategy required you to identify levels of support and resistance and wait for a breakout point, the support/resistance strategy will need you to identify them and then utilize pattern in the levels. How can you are doing that? Read on and discover.

What is the support/resistance strategy?

The support/resistance is a short-term strategy that can help you utilize the levels of support and resistance to your great merit. How is this particular possible? It’s rather simple, really. When the price tests the actual support/resistance, it can go in and the opposite direction. This is where by you enter the actual trade – following the price features tested the levels. Of course, this particular doesn’t guarantee anything, but it leaves you using a nice chance connected with winning.

60-second binary options tend to be fast-paced trades so you should be quick about it but not let yourself fall in a pattern of just waiting and looking at the charts as you might miss as soon as and enter the trade in a very wrong time, when the price is just about to reverse directions again. You need to be really quick so as to utilize this strategy in order to improve your chances of winning. Speed isn’t everything, though. It’s also crucial that you study the chart and establish previous patterns prior to enter a trade. The more information you have, the more likely you can be successful.

What do you need to realize to make this strategy work?

The required skill set here is pretty in the same as the one required through the breakout strategy. You need to find out at least basic technical research. You will have to examine charts, so you need to know the type of chart your broker is using. The most popular today are the candlestick and bar charts and they are the ones you should utilize since they show you lots of information and ensure it is easy to establish a support and resistance level. Of course, you also need to determine what support and resistance are and how you can establish them.

When the price can’t go below a certain level, we call that a support level. In order to establish support, the price has to consistently be unable to breach that level. In the case of support, it’s the same, but the price can’t above a certain value. Once more, this phenomenon has to be observed several times in order to establish it.

The best thing about this strategy is that it gives you a great chance of success if you’re quick enough. Usually when the price tests the level of support/resistance (which means reaching it without breaking it), it goes in the opposite direction, which is when you should enter the trade. You need to be quick, though. Enter too early and you may hit it right when it tests the level, which means that it will be at its highest/lowest and you will lose (unless you’ve made the right call, which is not likely if you screwed up your timing). Enter too late and you may hit the reversal when the price had changed direction, gone up or down, and now is reversing it again.

It’s important to note that levels of support/resistance are established when there are relatively small price movements. The price will move between the support/resistance levels and these movements can be quite fast, albeit insignificant in the long scheme (because there is little trading of the underlying asset, the price is stable in the long run which means that these fluctuations aren’t relevant for long-term investors).

What this means is that you need to be precise and make quick decisions, as well as enter trades at the right time. The safest time to enter is right after the support/resistance has been tested. This is when the price is sure to be in the opposite direction at least for a little while. If it’s tested the support, then place a call trade because it’s likely to go up. If it’s tested the resistance, place a put because it’s likely to go down.

In order to minimize the risks, you shouldn’t trade more than 5% of your capital. All in all, there is no such thing as a “sure strategy” so you need to always be prepared for the possibility that you will lose.